|
www.justforkidsonly.com |
HOME / SITE MAP / BACK TO MATH
|| PRE-ALGEBRA ||
|| THE COORDINATE PLANE AND POINTS ||
FOR AGES 10 AND 11
POINTS TO REMEMBER :
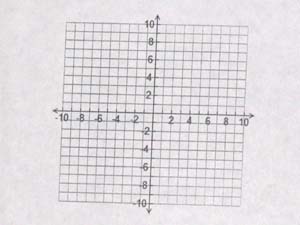
The coordinate plane, or the rectangular coordinate system, includes two axis.
1. The horizontal x - axis, and
2. The vertical y - axis.
Both, the horizontal x - axis and the vertical y - axis, intersect, at right angle (PERPENDICULAR) to each other, at a point which is called the " origin".
The origin's coordinates are (0, 0).
The points on a graph are named by an ordered pair.
For example:
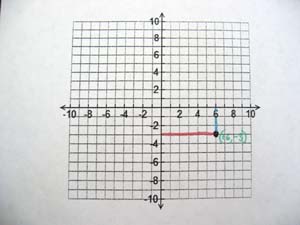
(+6, -3)
There are two numbers in an ordered pair.
The first number in an ordered pair is the x-coordinate, and
the second number is the y-coordinate.
In the above example, the first number - number +6, is the x-coordinate and
the second number, number -3, is the y-coordinate.
How to graph a point on the coordinate plane?
First draw the coordinate plane with the horizontal x-axis and the vertical y-axis with "tick marks" on both the axis denoting the scale.
Both the axis intersect at the "origin". The origin's coordinates are (0, 0).
The tick marks on the x-axis right to the origin are "positives" and left to the origin are "negatives".
In the same way, the tick marks on the y-axis above to the origin are "positives" and below the origin are "negatives".

Now, to graph a point on the coordinate plane, first find out the x-coordinate and y-coordinate of the point. For example, in the above point the x-coordinate is +6 and the y-coordinate is -3.
Thus, the position of a point in the coordinate plane is determined by its distance from the axis.
Next, starting from origin, count +6 (that is 6 points right to the origin) along the x-axis scale. Then, starting again from origin, count -3 (that is 3 points below the origin) along the y-axis scale.
Mark the point.

Similarly, mark other points on the coordinate plane.
This is called graphing.
Isn't it simple!
|
SEND US YOUR OWN IDEAS |