|
www.justforkidsonly.com |
HOME / SITE MAP / BACK TO MATH
|| PRE-ALGEBRA |||
| GRAPHS OF LINES ||
FOR AGES 10 AND 11
POINTS TO REMEMBER :
Linear equation..
y = mx + b
where, m is equal to the slope of the line,
and b is equal to the y-intercept which is the point at which the line crosses the y-axis.
And x and y are the x and y coordinates of a point on the graph.
How to graph a linear equation?
First select an x-coordinate and put that in the linear equation y = mx + b in place of x.
Then solve the equation.
This will give you the value of y.
Now you have values of both x and y for the linear equation.
Repeat the same process to find out x and y coordinates for 3 or more points.
Now graph all the points on the coordinate plane and connect them.
The line you make will be the graph of the linear equation given to you.
For Example:
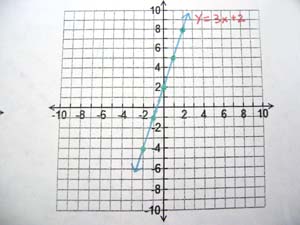
Graph: y = -3x + 4
Now select, for example, 0, +1, +2, -1, and -2 for x and solve the above equation to get different values of y.
y = 3x + 2
y = 3(0) + 2
y = 0 + 2
y = +2.
Same way find out the values of y for the other x values.
| (x, | y) |
| (0, | +2) |
| (+1, | +5) |
| (+2, | +8) |
| (-1, | -1) |
| (-2, | -4) |
Now graph all the coordinates.
You will get the graph of linear equation: y = -3x + 4.

|
SEND US YOUR OWN IDEAS |